Getting ready for take-off, Part 2: Predicting AAM ridership in New York City
Exploring demand forecasting and key insights for eVTOLs and Advanced Air Mobility in New York City.


This article is part of Steer's “Getting Ready for Take-Off” series on Advanced Air Mobility.
Welcome to ‘Getting ready for take-off’, Steer’s series on Advanced Air Mobility (AAM). Since 2021, Steer’s infrastructure and aviation teams have been working on ridership and revenue forecasting for electric vertical take-off and landing (eVTOL) aircraft, a groundbreaking form of aerial transit that until recently was a thing of science fiction.
Today, we know that eVTOLs will soon be taking to the skies of cities across the US and the world, making journeys simpler for passengers and easing congestion on the gridlocked streets below. How many people will be riding in these aircraft? What will the price point be? And what legislation and regulatory policies will govern their introduction? These questions and more will be answered in our series. Read below to find out more.
Over the last year, Steer’s infrastructure and aviation teams have joined forces to carry out a study of potential vertiports in New York City, testing the data to find the answers for a relatively unknown technology.
While AAM is a new and innovative transport mode, the fundamentals for predicting its demand have common elements with our forecasting approach for mature modes like rail, highways and aviation.
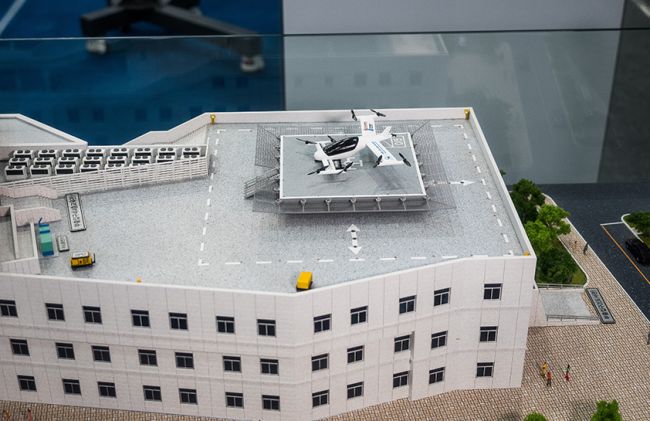
We know the location of the vertiports is key, and that to maximize benefits they should be positioned near high traffic areas and transit hubs. Steer’s New York study considered three locations: JFK Airport (JFK), Downtown Manhattan and Grand Central Station.
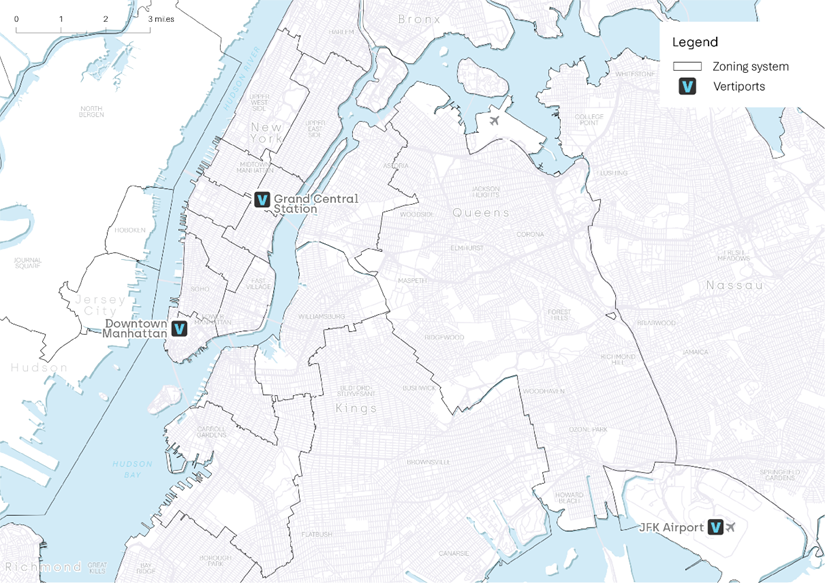
Given Federal Aviation Administration (FAA) regulations, electric Vertical Take Off and Landing aircrafts (eVTOLs) would be required to follow designated routes and altitudes to ensure safety and minimize disruptions. In particular eVTOLs will be restricted to fly over specific areas of the Hudson River corridor, thus avoiding residential areas as much as possible. The map below shows the locations and routes we considered for the study.

Based on our understanding of how the AAM would initially operate we assumed that the cost of the eVTOL will be $10 per passenger per mile, our research suggests this cost could vary between 5 and 15 $/mile depending on the type of the aircraft, route distance and city.
The average speed of eVTOL will be 149 mph for cruise and 75 mph for other flight stages, with processing times for passengers at 21 min in total for departing and arriving at vertiports, which aligns with current helicopter services, but is expected to decrease over time. This time allows for check-in, security controls, waiting time, safety briefing and boarding/ deboarding. We assumed the AAM system would initially only operate between 6 am and 9 pm, not overnight, similar to current helicopter services in NYC.
Based on the above information, we predict flight times and costs between vertiports, excluding vertiport processing times, to be 11 minutes and $210 from JFK to Downtown Manhattan, 13 minutes and $260 from JFK to Grand Central Station, and five minutes and $140 from Downtown Manhattan to Grand Central Station.
Based on the zoning system shown in the map below, which covers New Jersey, Manhattan, Queens and Brooklyn.
Key findings
Using our approach, we were able to create a baseline we could use to run different scenarios and found some never-before-seen key insights on AAM.
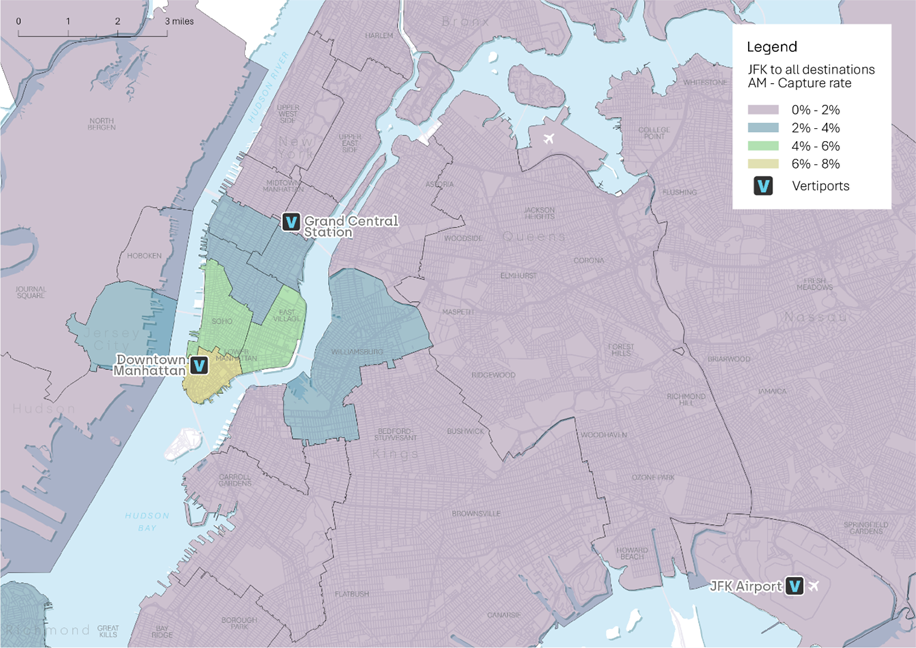
AAM has high Ridership potential with the system we proposed, possibly moving up to 1,000 passengers per day and raising close to $55M in revenue per year. This is despite the capture rate (the percentage of air passengers likely to use the eVTOLs) remaining quite low and reducing with the amount of additional connectivity required for riders to complete their journeys—first/last-mile connectivity matters, with travelers preferring seamless integration with existing transit/taxi systems.
The flying path connecting each vertiport is an important assumption, with direct flight paths proving more popular in our model. The JFK to Downtown Manhattan route proved the best link, providing a competitive journey time compared to other options. In contrast, the long route from JFK to Grand Central over the river, dictated by safety measures, makes the journey time less competitive, resulting in lower-than-expected ridership.
We found that eVTOLS have a more competitive edge during peak times, when congestion is at its worst and creates unreliable travel times. Taxi users are the primary target as transit riders fall out of the affordability bracket.
In fact, we found that cost per mile is the single biggest driver, with lower fares dramatically increasing ridership. Shorter waiting times significantly improve competitiveness. As vertiport processes streamline, overall journey time will decrease, and ridership will increase. Our analysis assumed long waiting times mirroring current helicopter services, but we expect this to change as the market develops.
Our study highlights the immense potential of AAM in New York City and the importance of strategic planning, pricing, infrastructure development, and operational efficiency. As regulatory frameworks evolve and technology improves, AAM will become an increasingly viable urban mobility solution.
With the right investments, partnerships, and infrastructure, cities like New York can pioneer a new era of efficient, fast, and sustainable air mobility.
The key elements of our forecasting approach are:
Inputs
- In-scope demand: This is the total travel demand that could reasonably consider using the eVTOLs. We used traffic and transit data to estimate volumes for each mode and cell phone data to understand trip patterns within the study area. We have estimated the demand at the OD level for three modes: auto, taxi (including TNCs) and transit.
- Segmentation: We have considered three Value of Time groups for each mode to represent different willingness to pay and travel behaviors. The combination of this segmentation and the in-scope demand by mode leads to nine different market segments that could consider the eVTOLs as part of their journey.
- Travel Times and Costs of Current Modes: These are the cost components of the existing modes that travelers will consider when choosing what mode to use. They include walking time, waiting time, and in-vehicle time along with mode specific costs such as toll rates, congestion charges and parking.
- AAM Times and Costs: We have used the operational assumptions discussed above and estimated times and costs associated with the AAM system. We have assumed that, if needed, the first and last leg of the trip is covered by taxi with its associated costs.
- Behavioral parameters: We have adopted behavioral parameters from other studies we have done in the area to represent how people perceive the costs and what is important in their travel arrangements. Parameters are different by mode and by market segment.
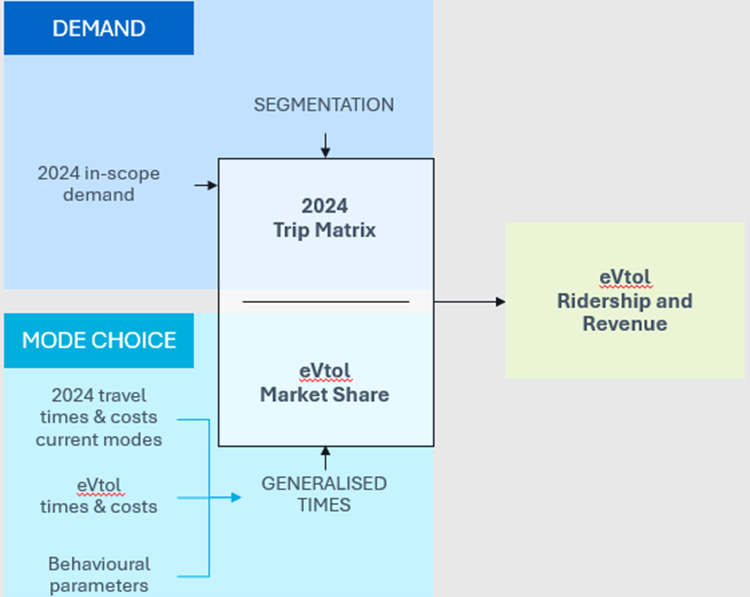
Outputs
- Generalized Costs: Combining the time and costs, along with the behavioral parameters, we calculated generalized costs for each existing mode as well for the AAM system.
- AAM market share: Generalized costs are estimated at OD level and used as inputs into a choice model that calculates the market share for AAM. We have used a binary choice model that compares the generalized cost of each existing model versus the AAM system to estimate the expected market share.
- AAM Ridership Forecasts: Expected Market shares are applied to in-scope demand, by mode and segment, to determine potential ridership. We tested different scenarios to understand the impact that different assumptions have on the forecasts.
Explore the Series: